
The Kapernikov Infra Data
Approach
Automate your RINF data flows. Stop manual reporting.
The Problem
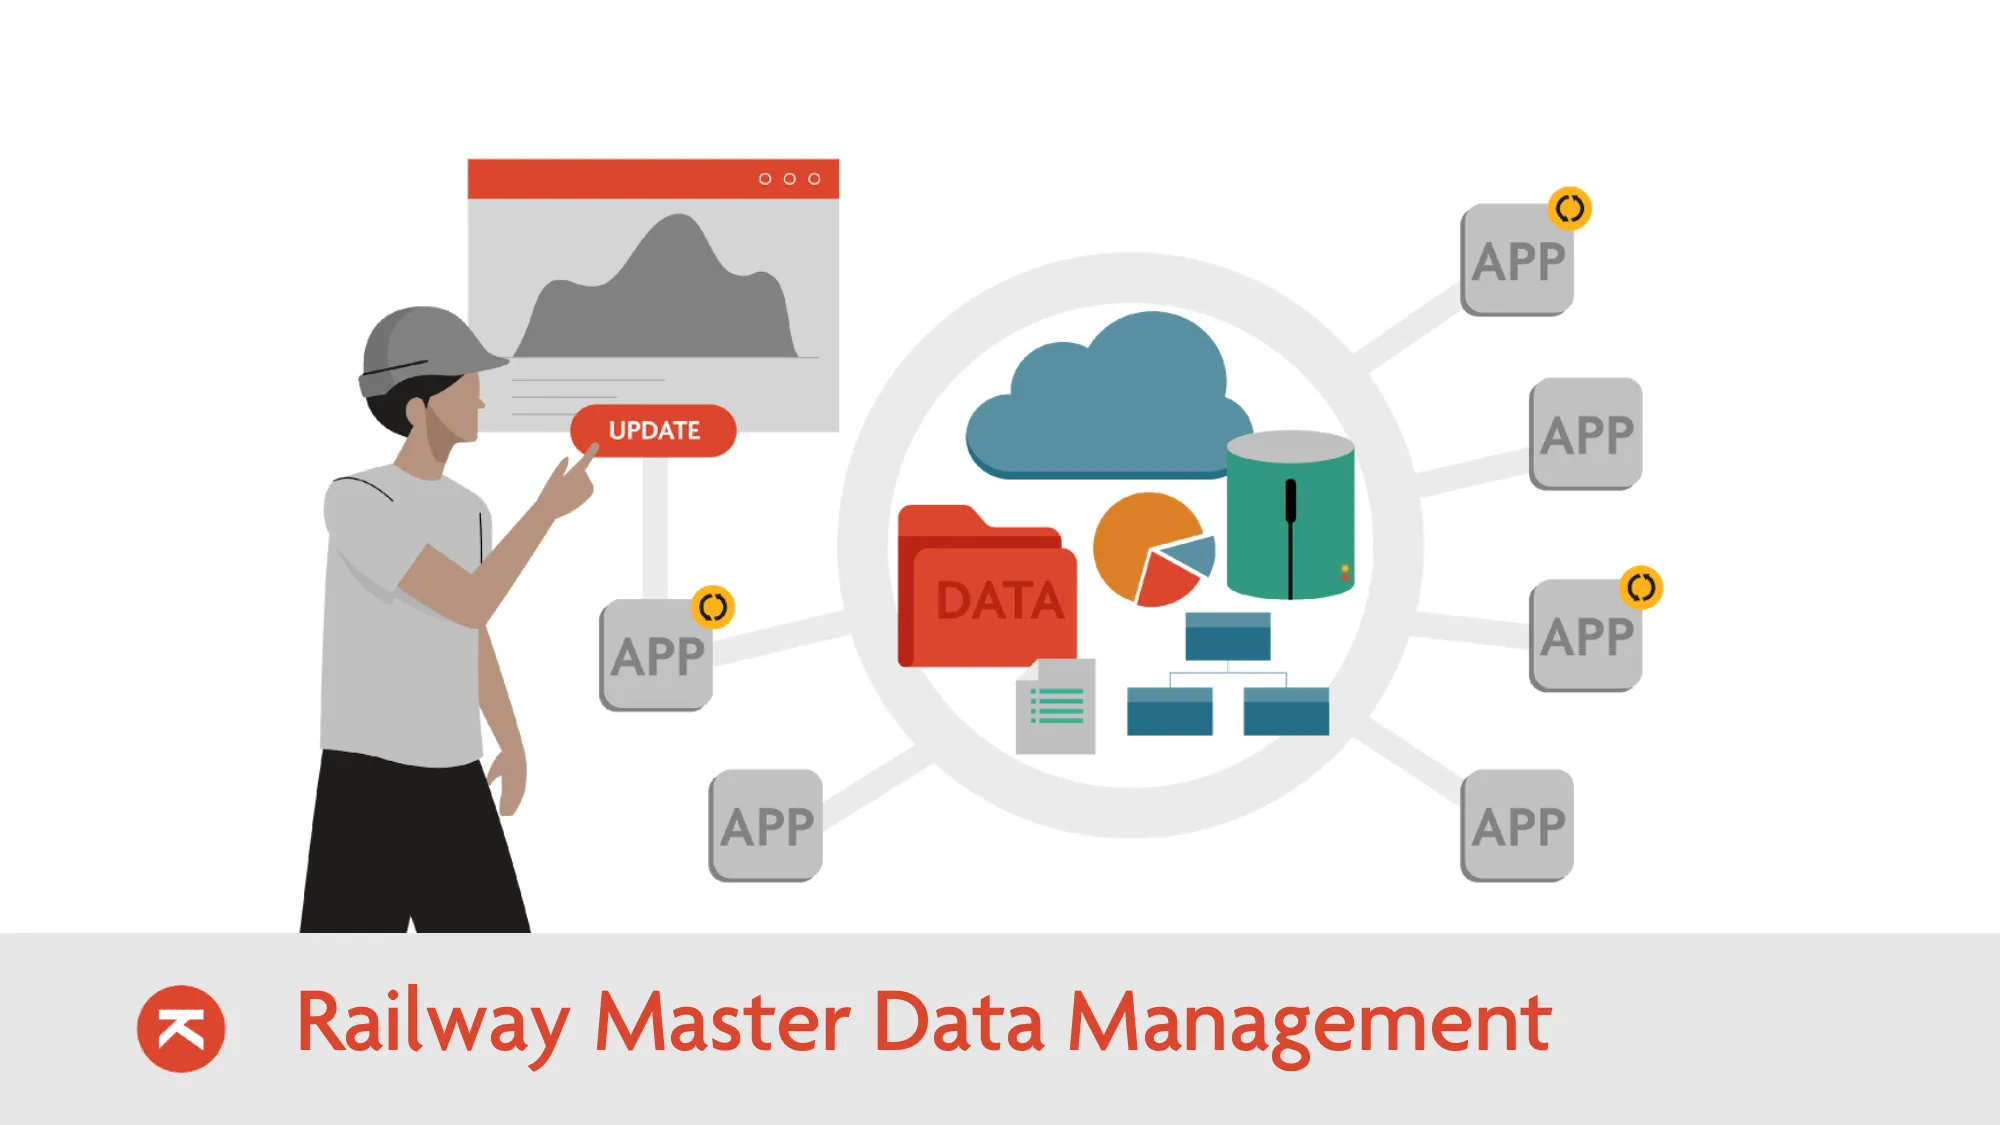
Your data is scattered. CAD drawings, signaling plans, Excel spreadsheets, and legacy Access databases. Bringing this together for RINF 3.1 is a manual nightmare.
"Data changes every day. Your RINF report is outdated the moment you send it."
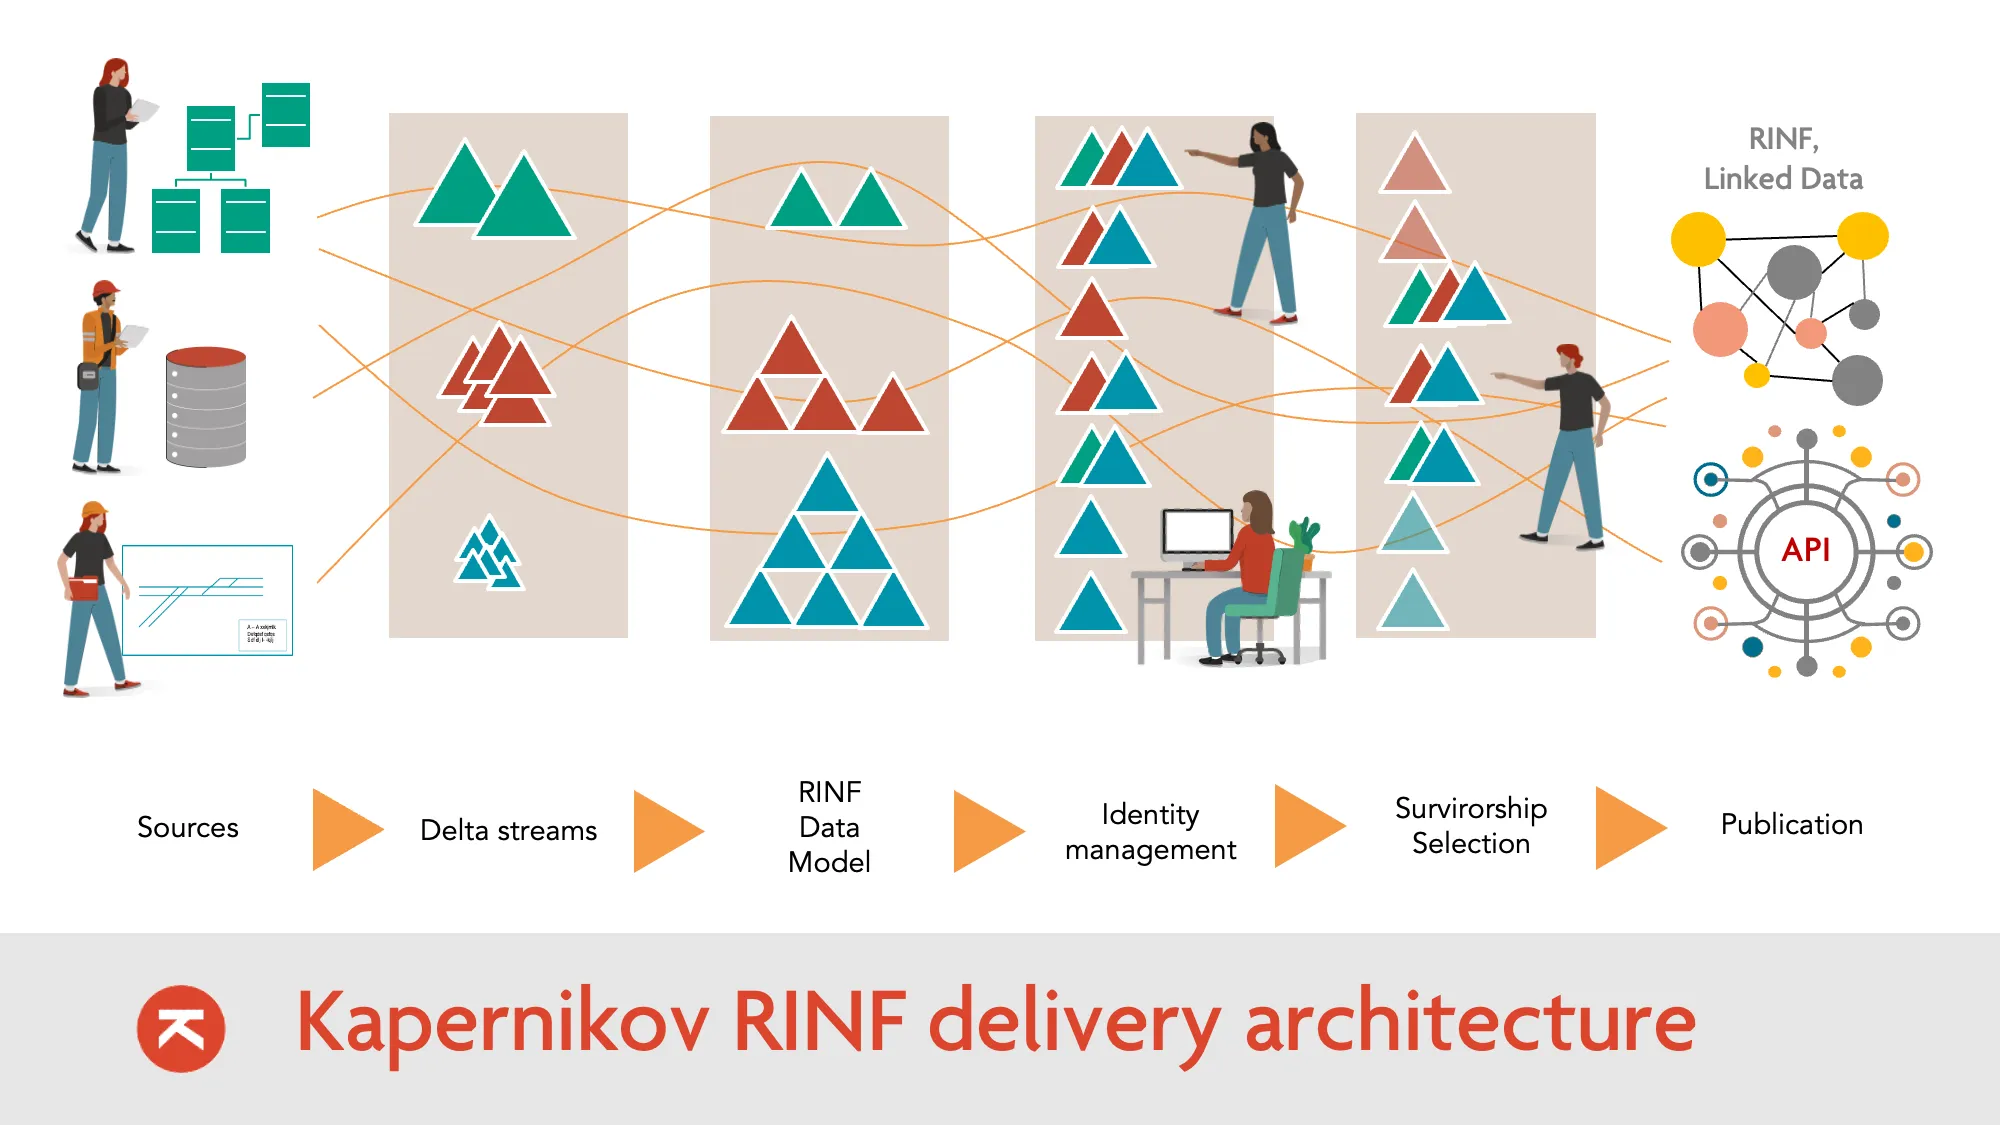
The 6-Step Pipeline
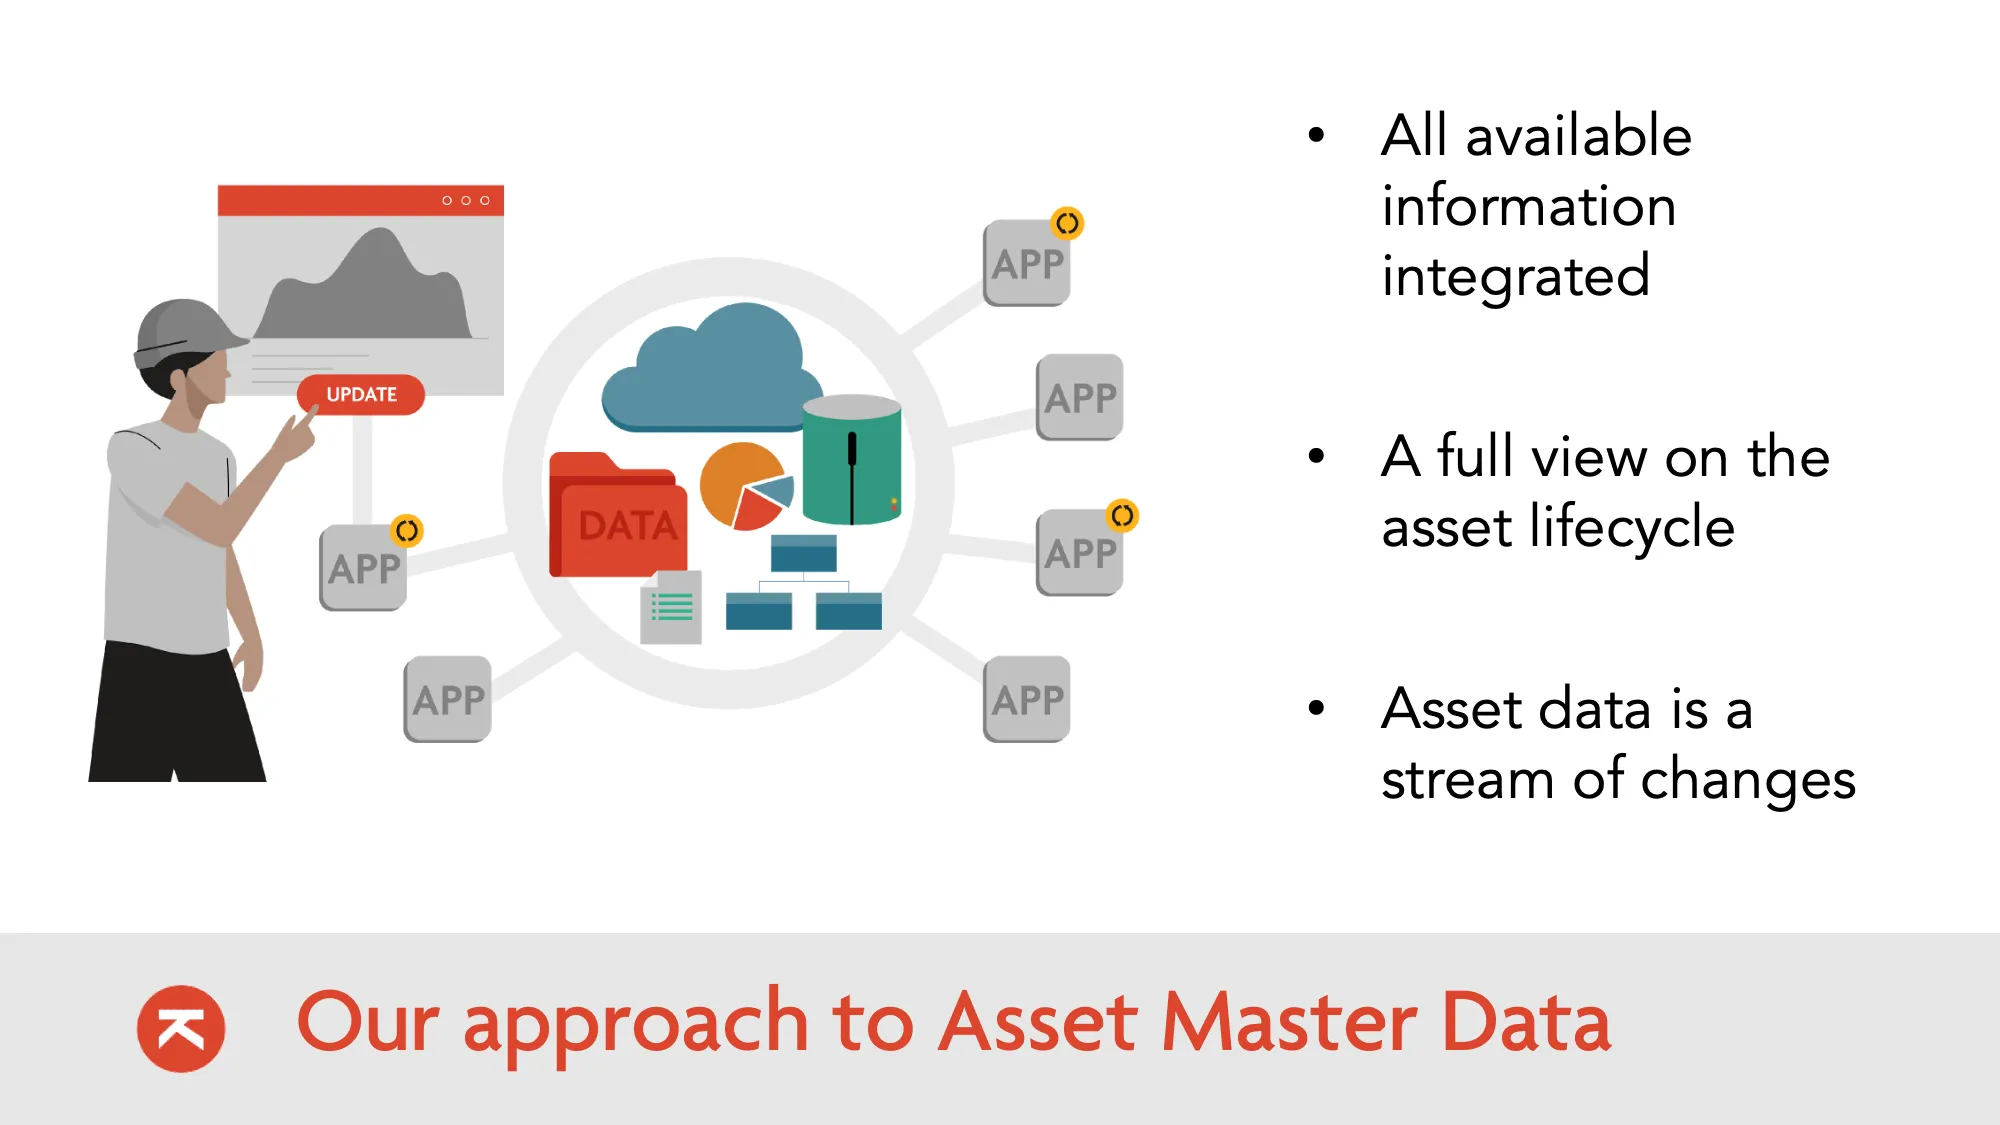
We build a data factory, not a one-time report. Every step is automated, auditable, and repeatable.
Load
We start by connecting to your existing data landscape. GIS exports, SAP extracts, signaling configuration files, Excel inventories, legacy Access databases—whatever you have, we ingest it.
No data transformation at this stage. We extract raw data as-is, preserving the original structure and values. This ensures nothing is lost or misinterpreted at the source.
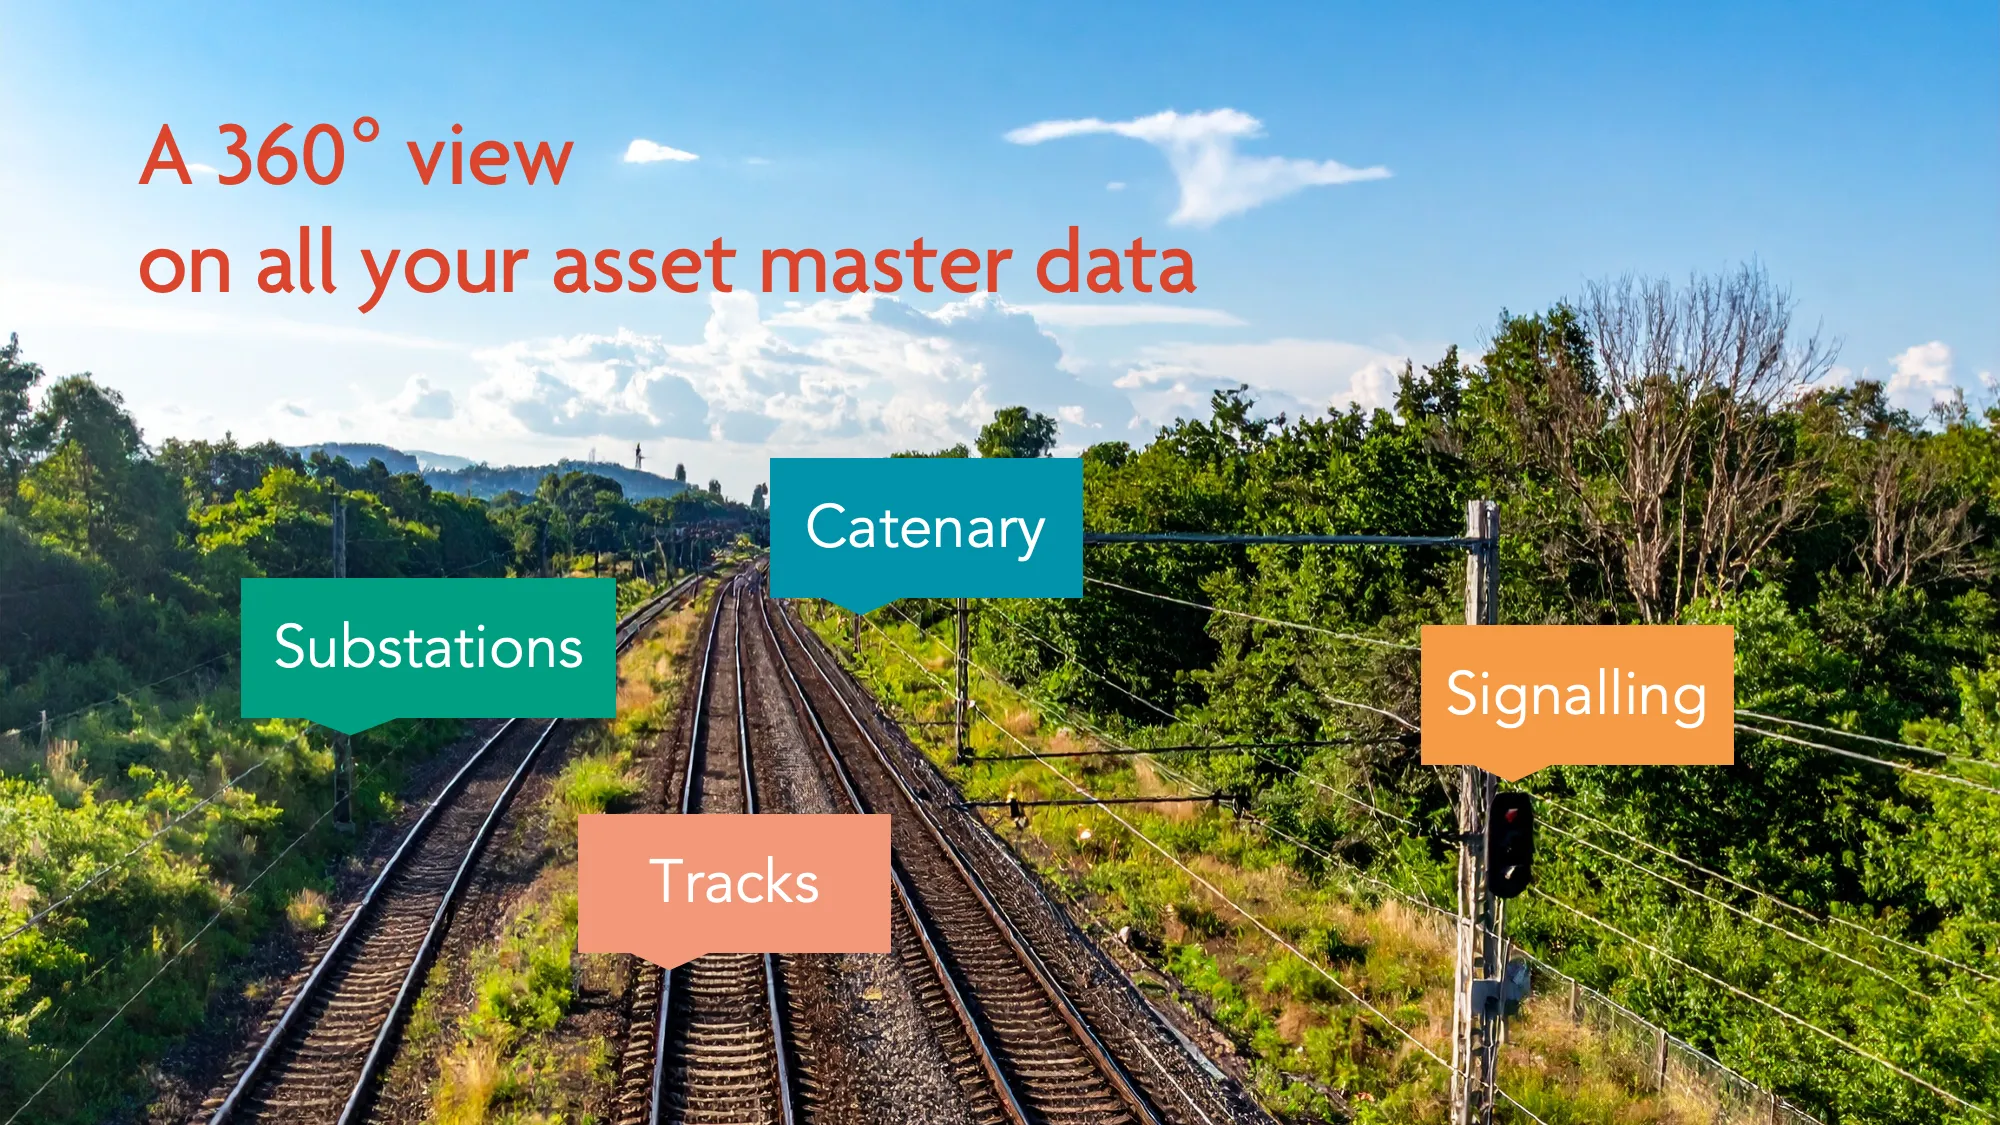
Typical sources: Net Declaration (XML), GIS shapefiles, SAP exports, signaling plans (PDF/XML), track geometry databases, catenary inventories.
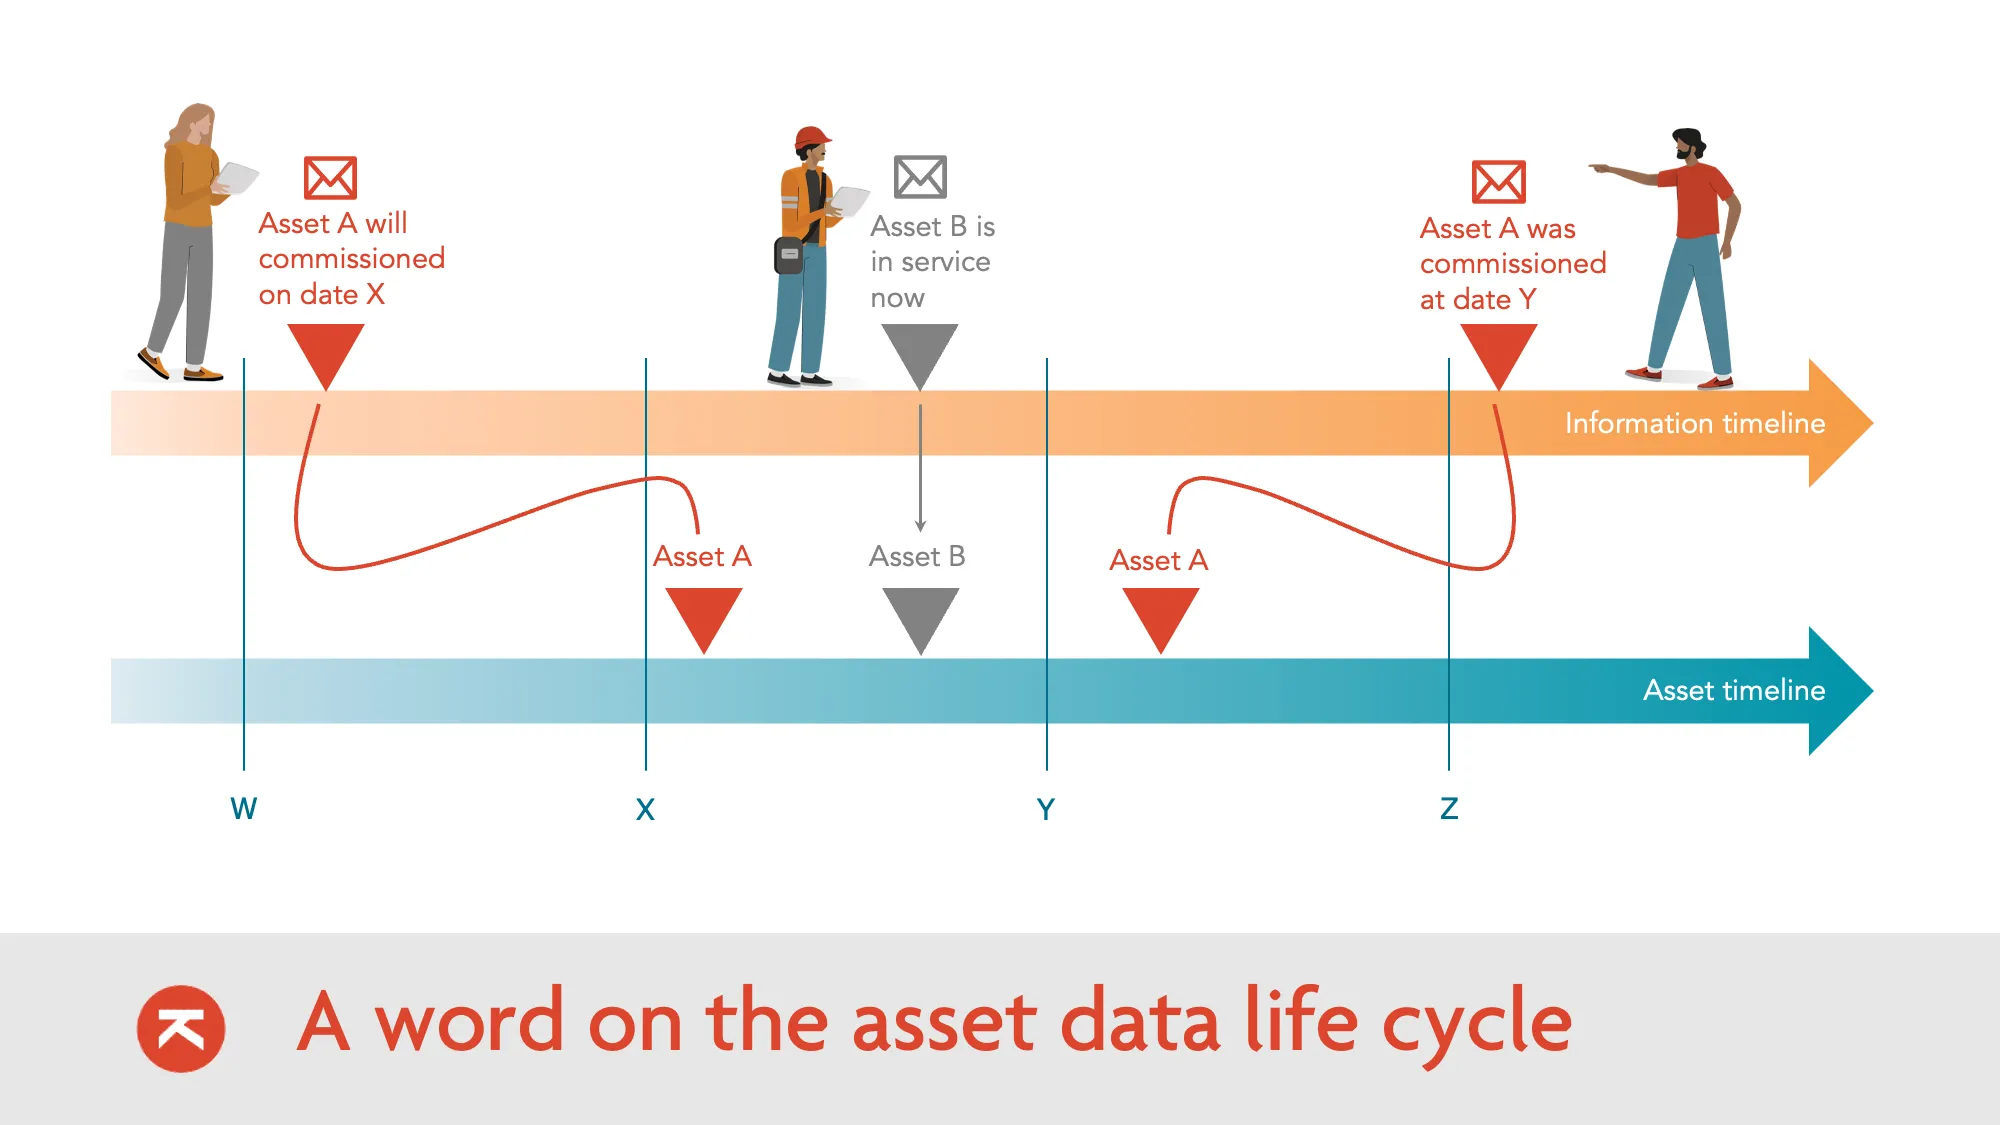
Convert to Delta Streams
Raw data is converted into Delta Streams—a continuous stream of change events (inserts, updates, deletes) rather than static snapshots.
This architecture enables two critical capabilities:
-
Bitemporality: We track both Valid Time (when something changed in reality) and Transaction Time (when we learned about it). You can query "what did we know on date X about the state on date Y."
-
Replayability: If a rule changes, we can re-process historical data without re-extracting from source systems. Full audit trail.
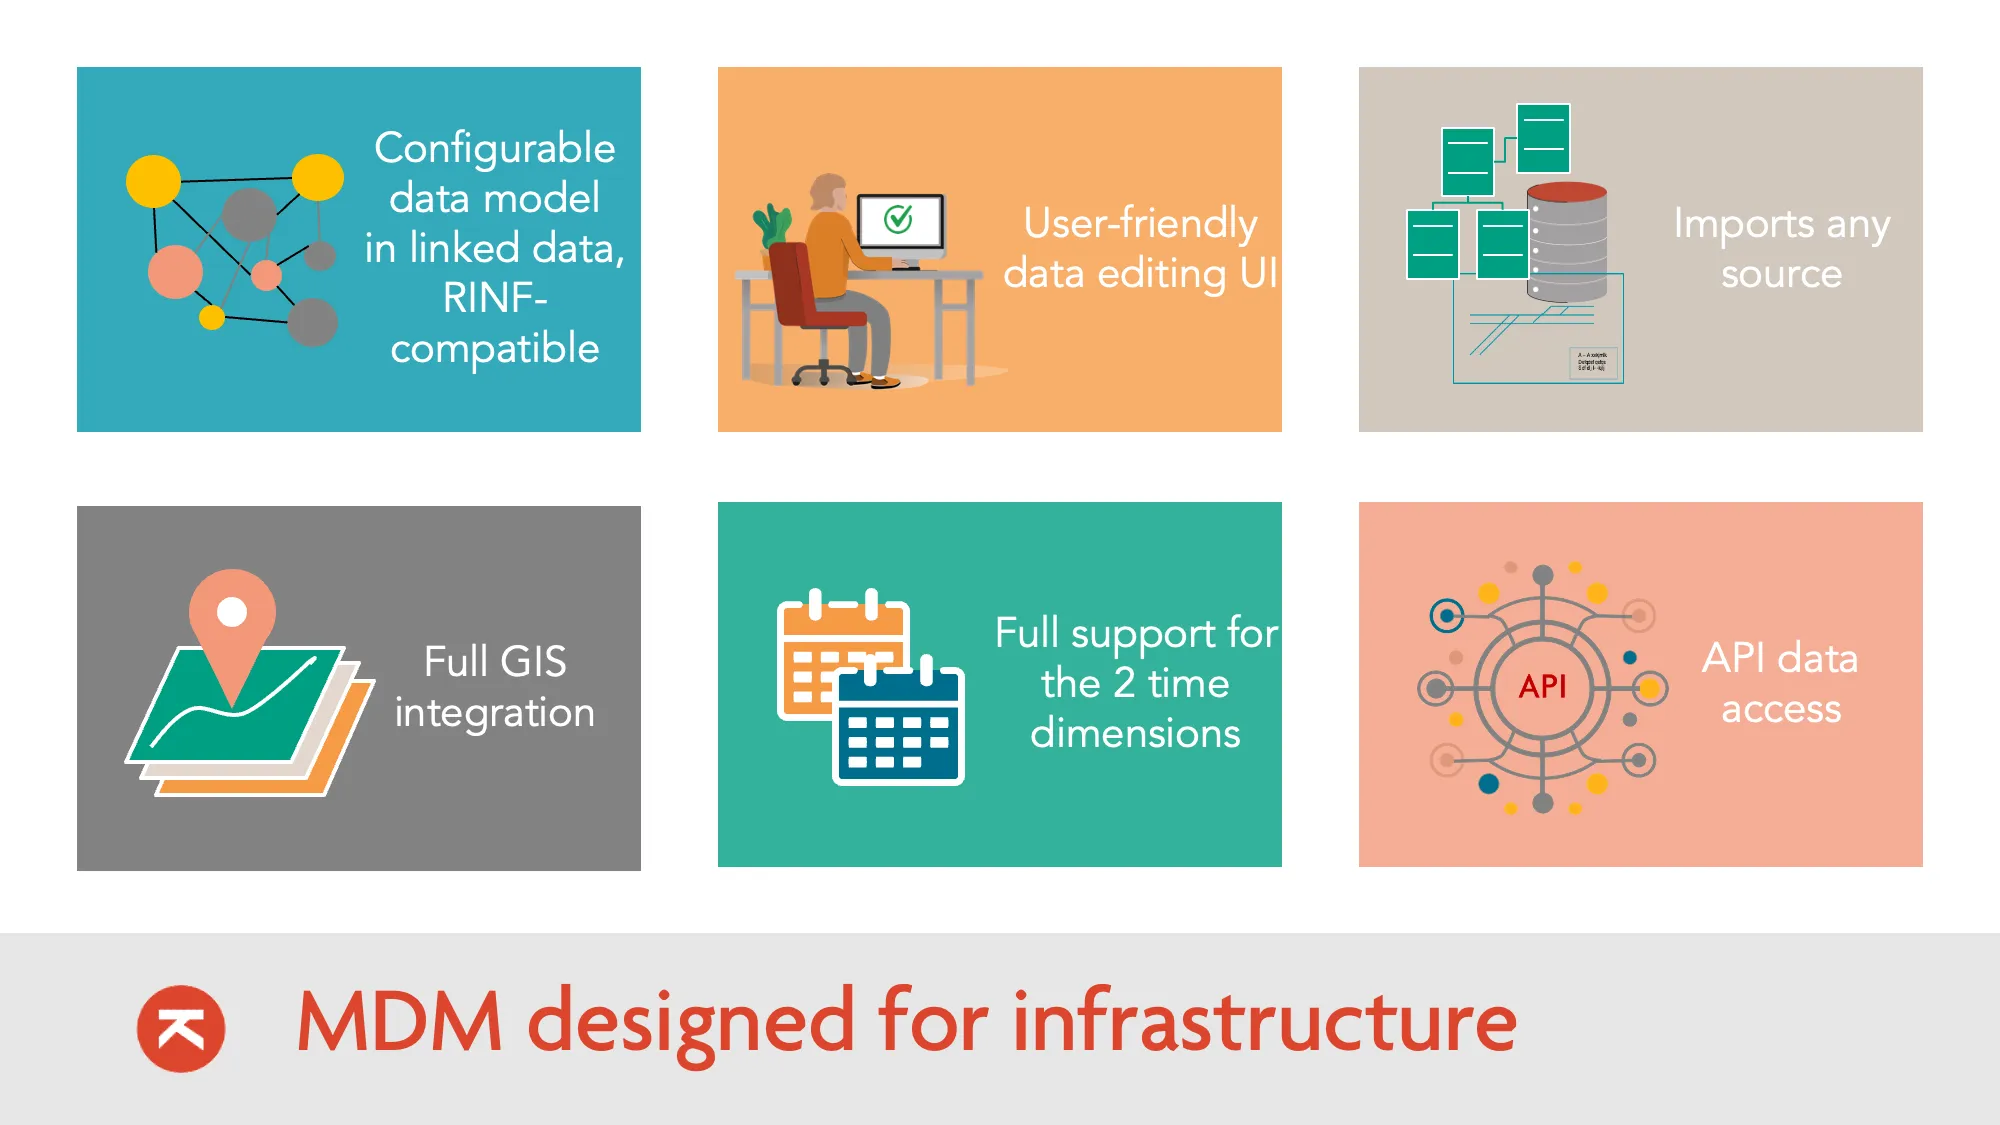
Linked Data Model (RINF Ontology)
We map incoming data streams to a standardized model using LinkML. The model is directly aligned with the ERA RINF Ontology—so compliance is built in from day one.
This isn't just schema mapping. We define the semantic
meaning of each field. "Track gauge" in your GIS becomes era:trackGauge with the correct units and validation rules.
Model-driven: Validators, APIs, and documentation are auto-generated from the model definition. Change the model, everything updates.
Identity Mapping
Different systems call the same asset by different names. GIS has "Pole 123", SAP has "Asset 998", the signaling database has "OC-SW-045". They're all the same physical switch.
We resolve these aliases into a single, canonical URI. The approach is hybrid:
-
Automated matching: Deterministic rules first (exact ID matches, spatial proximity, naming conventions). Most matches are resolved automatically.
-
Expert review: Uncertain cases are queued for human decision. A modern web UI shows candidate matches with supporting evidence. Data stewards confirm or reject.
Every identity decision is logged. You can always trace why two records were linked.
Survivorship Selection
When sources conflict, which value wins? GIS says the track was installed in 2015. SAP says 2014. The measurement train says the gauge is 1435mm, but the database says 1432mm.
We define Survivorship Rules—configurable policies that automatically select the "golden" value:
-
Trust GIS for coordinates. Trust SAP for installation dates. Trust measurement trains for current geometry.
-
Most recent value wins. Or: most frequently occurring value. The rules are explicit and configurable.
Complex conflicts—where rules can't decide—are escalated to the same expert UI. The data steward creates the "Golden Record."
Output
The governed data is published. Multiple outputs from the same source:
RINF Submission
Direct RDF graph submission to ERA. SHACL-validated before publishing. No manual file handling.
Delta Streams Out
Clean data fed back to internal systems. The master data becomes the source for downstream applications.
Knowledge Graph
SPARQL endpoint for analytics. Query across all your infrastructure data with a single interface.
How It Works
Ready to start?
Kapernikov Infra Data is currently running at major European infrastructure managers.
Book a call